Talking Points:
- Support and Resistance can help guide traders with entries and exits.
- New traders often make it more difficult than it really is to identify these levels.
- Learn how to use Psychological levels , Swing highs/lows, and Pivot Points.
"Support and resistance" is common jargon for areas
on the chart where price has a difficult time breaking through. Support
levels tend to stop price from falling below a specific point and
resistance levels act like a price ceiling that price cannot break
above. Knowing where these levels are make it much easier to decide when to open and close trades,
but how can we locate these prices to begin with? Today we will cover 3
simple ways to identify support and resistance in Forex.
Psychological Levels
Often called "psych" levels, psychological levels
occur when price ends with multiple 0's. It's human nature to gravitate
towards round numbers when discussing any topic that involves numbers,
Forex included.
For example, when traders talk about what they think the Euro
will be worth in the future, they probably won't give an answer of
1.4278 or 1.3044. They are much more likely to round off the price to
something simpler, like 1.4300 or 1.3000. The same thing happens when
Forex traders place their orders. We will often see clusters of orders
around these whole numbers, which creates price levels that can affect
how price behaves. That's exactly what we want for our support and
resistance levels.
The most common psych levels involve price having two zeros at the end (not including the 1/10th of a pip), such as 1.6400 or 102.00. More powerful than that would be psych levels ending in three zeros, such as 1.3000 or 120.00. Leaving the most powerful psych levels of all, four zeros at the end, 1.0000 or 100.00. The chart below has four levels drawn at psychological levels. We can clearly see their effect on price action.
Learn Forex: Psychological Level


Learn Forex: Psychological Level
Swing Highs & Lows
Another great way to find support and resistance
levels is to mark levels in the past where price had a difficult time
breaking through. As price moves up and down, each level that price has
bounced off of could be a level in the future that price bounces off of
again. This is a manually intensive method and takes time to draw on all
the currency pairs that we trade, but can pay off in the long run.
Learn Forex: Swing Highs & Lows Acting As Support & Resistance
As the EUR/USD
chart shows above, a level was drawn when price reached a new high or
low (red circle). Later when price approached these levels again, they
bounced off the same levels (white circles). The effect will not always
be this clean, but it does occur fairly often. This is a method used
quite often in Range Trading. We can buy at support with our stop loss below and we can sell at resistance with our stop loss above.
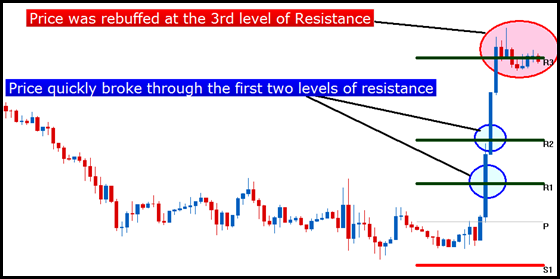
Pivot Points
Arguably the easiest support and resistance levels
to add to our charts, pivot points are a built-in indicator on FXCM
platforms that will automatically draw key levels without any effort on
our part at all. Pivot points are created by the previous period's High,
Low and Close prices, with the most common period size being the Daily
period. We can use these levels just like any other potential support
and resistance levels on our charts.
Learn Forex: Pivot Points
Lines O' Plenty
Support and resistance doesn't have to be confusing.
We can mix and match any of the methods above and create a healthy
amount of price levels that we can trade. As always, practice makes
perfect. So make sure to test out these methods yourself on a Real-time FXCM Demo using their award winning charting package.