Talking Points:
- Primary Way of Drawing Fibs
- Taking Key Impulses on the Chart to Draw Fibs
- Looking For Confluence Price Targets
It’s easy to feel like you’ve found the Holy Grail when you’re first introduced to the Fibonacci sequence
and furthermore, the Fibonacci ratios. The common Fibonacci ratios of
38.2%, 61.8% & 76.4% can help you spot a turn-around in a correction
off the prior trend. However, the way you’ve likely been taught to
apply Fibonacci retracements to the chart is the only way to squeeze
value out of this great tool.
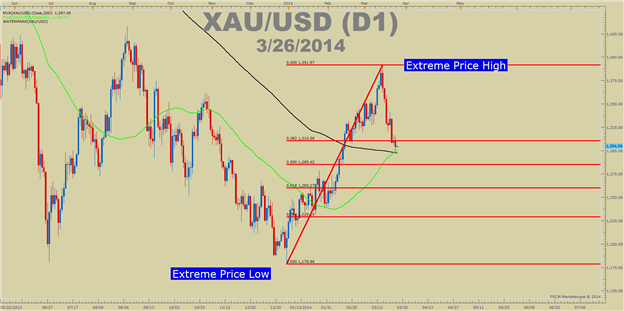
Primary Way of Drawing Fibs
Fibonacci seems so easy at first. All you have to do
is pull up a chart and then draw a Fibonacci retracement from the
highest high to the lowest low. However, if you’re familiar with Elliott Wave,
you know that a lot of trends and corrections happen within the highest
high to lowest low. Therefore, the primary way of drawing fibs (highest
high to lowest low) may not be the most helpful way for trading.
Learn Forex: Traditionally, Fib Retracements Are Drawn From Low to High
Taking Key Impulses on the Chart to Draw Fibs
The key idea to focus on here is that charts are
fractal and so are trend moves. Fractal is a fancy way of saying that
within one large move higher (or lower) there is many smaller bullish
(bearish) trends and bearish (bullish) corrections. Fibonacci
retracements are great to help you see where the correction against the
trend could run out of steam so we can dissect the moves to help
fine-tune some of the levels you should be focusing on.
Learn Forex: Fibonacci Retracements Applied to Individual Impulses
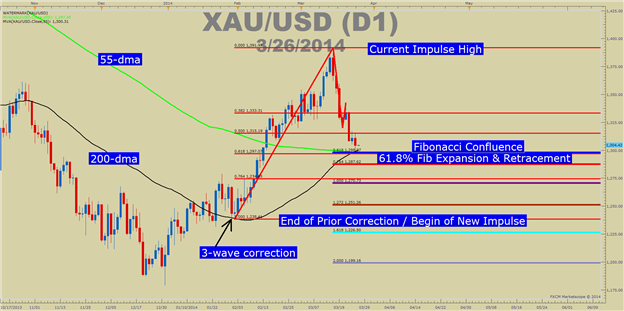
As you likely learned in a prior article, traders would do well do look for confluence of Fibonacci levels. Fibonacci
confluence develops when a Fibonacci expansion and Fibonacci
retracement come together. The chart above shows not only a combination
or cluster of Fib levels around 1297 but also the 55-dma & 200-dma
could act as support. One thing is for sure, a lot of traders using
different tools could well be looking to buy XAUUSD from these levels.
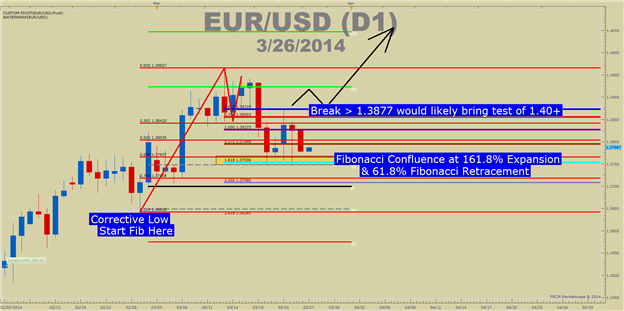
Looking For Confluence Price Targets
Confluence can help you do two things. First, if
you’re trading the correction, you can look to exit the trade at strong
Fibonacci confluence levels or bring your stop to break even so that you
can ride out the correction or new trend with little risk. Second, if
you focus only on trading in the direction of the overall trend, a key
price action signal off of a Fibonacci confluence level can help you to
re-enter the trend at a great level.
Learn Forex: Strong Fib Confluence on EURUSD should keep your attention
Closing Thoughts
Adjusting your Fib start and end points can be very
helpful. Look for strong impulsive moves to start drawing your fibs as
opposed to extreme highs and extreme lows. Regardless of your newfound
knowledge, continue to manage your risk and I hope you find yourself
entering into the trend earlier than before.
Happy Trading!